A linear relationship between two variables \(x\) and \(y\) is a relationship with a constant rate of change between the variables. For example:
linear
A person buys one taco and is charged $\(2\). A second person buys two tacos and is charged $\(4\). Another person buys three tacos and is charged $\(6\). This is a linear relationship between \(x\), tacos, and \(y\), cost, as the cost is changing the same amount for each one increase in \(x\).
not linear
A person buys one taco and is charged $\(2\). A second person buys two tacos and is charged $\(3\). Another person buys three tacos and is charged $\(3.50\). This is not a linear relationship between tacos and cost because the price of the taco changes at a different rate based on the number of tacos purchased. The price started at $\(2\). It increased by $\(1\) after the second taco. It increased by $\(0.50\) when adding a third taco. The price increases at different amounts for each one increase in \(x\).
Here is a table of linear taco data:
| tacos | price |
| 1 taco | $2 |
| 2 tacos | $4 |
| 3 tacos | $6 |
| 4 tacos | $8 |
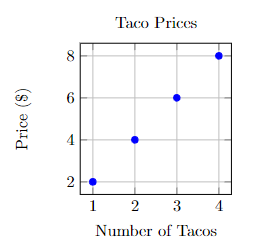
We can graph this data.

As the dots go up as we read the graph from left to right, we call this a line with a positive slope.
Here is the table of non-linear taco price data.
| tacos | price |
| 1 taco | $2 |
| 2 tacos | $3 |
| 3 tacos | $3.50 |
| 4 tacos | $3.75 |
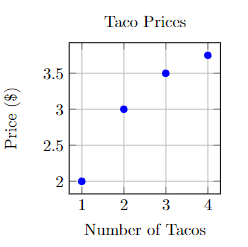
Here is the graph of the non-linear taco price data:

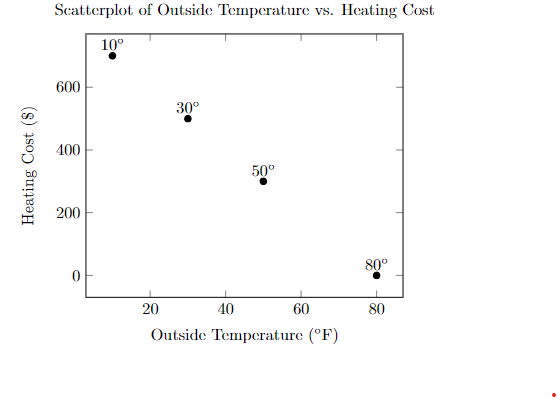
Lines can also decrease as we read the graph from left to right. We say that these types of lines have a negative slope. This relationship is also linear.
| outside temperature | heating cost |
| \(80^{\circ}\) | $0 |
| \(50^{\circ}\) | $300 |
| \(30^{\circ}\) | $500 |
| \(10^{\circ}\) | $700 |

If we determine a relationship is linear, we can calculate the slope of the relationship. The slope tells us how much one variable goes up or down based on one increase in the other variable.
| tacos | price |
| 1 taco | $2 |
| 2 tacos | $4 |
| 3 tacos | $6 |
| 4 tacos | $8 |
To calculate the slope, calculate the change in one variable divided by the change in the other variable.
\[\text{slope } = \frac{\text{change in one variable}}{\text{change in the other variable}}\]
You could calculate tacos as the top part of the formula and dollars as the bottom. Your units would be "tacos per dollar". If you calculated dollars in the top and tacos in the bottom, your units would be "dollars per taco". Either way is valid. The correct method depends on the question.
When we ordered 1 taco, we paid $2. When we ordered 2 tacos, we paid $4. The change in dollars is $2 and the change in tacos is 1. The slope is
\[\frac{\text{change in one variable}}{\text{change in the other variable}} = \frac{\$2}{1\text{ taco}} = \$2 \text{ per one taco}\]
1.
An employee has kept track of her pay based on the number of hours
per week worked.
| hours worked | pay |
| 20 hours | $375 |
| 25 hours | $468.75 |
| 30 hours | $562.50 |
| 35 hours | $656.25 |
Is the relationship between the hours worked and pay a linear relationship? If so, what is the slope in terms of dollars per hour?
When reading the table between row one and row two, we see the hours increases by 5 and the pay increases by $93.75. Between rows two and three, the hours increase by 5 and the pay increases again by $93.75. This appears to be linear as the dollar amount changes at a constant rate. The slope is
\[\frac{\text{change in one variable}}{\text{change in the other variable}} = \frac{\$93.75}{5 \text{ hours}} = \$18.75\] per one hour.
Note that we put dollars in the numerator as we were asked to calculate "dollars per hour".
2.
Sawmills pays lumberjacks (loggers) per board foot (a board foot
measures the volume of the raw lumber being brought in). A lumberjack
recorded the following pay they have received at a local sawmill.
| number of board feet | pay for the wood |
| 24 board feet | $150 |
| 52 board feet | $300 |
| 58 board feet | $320 |
| 70 board feet | $350 |
Is the relationship between the number of board feet and pay for the wood linear or nonlinear? If it is linear, what is the pay per board foot?
We can calculate the slope between the first and second rows. We are asked for pay ($) per board foot, so pay will be in the numerator. The pay changed by $150 and the number of boards changed by 28 board feet between these two rows.
\[\frac{\text{change in one variable}}{\text{change in the other variable}} = \frac{\$150}{28 \text{ board feet}} \approx \$5.36\] per board foot.
If the relationship is linear, the slope should be the same between the second and third rows. The price changed by $20 and the number of boards changed by 6.
\[\frac{\text{change in one variable}}{\text{change in the other variable}} = \frac{\$20}{6 \text{ board feet}} \approx \$3.33\] per board foot.
The relationship appears non-linear as the slope is not the same for each pair of data points.
1. A person runs a bakery. They have to pay employees to start up the bakery in the morning. Because of this, the cost per loaf of bread decreases if they bake many loaves at the same time.
| number of loaves | cost |
| 20 loaves | $25 |
| 40 loaves | $35 |
| 50 loaves | $38.75 |
| 80 loaves | $50.75 |
Is the relationship between the number of loaves of bread and the cost of producing the bread linear or non-linear? If it is linear, what is the slope in terms of dollars per loaf?
2. A man is coaching a youth soccer team. They contact a company to produce shirts. The table below outlines the price plan.
| number of shirts | price |
| 10 shirts | $20 |
| 15 shirts | $28.75 |
| 20 shirts | $32.50 |
| 30 shirts | $40 |
Is the relationship between the number of shirts ordered and the price linear or non-linear? If it is linear, what is the slope in terms of dollars per shirt?
3. An electrician sends their employee to the store to buy wire. The cost, depending on the length of the wire, is listed below.
| number of shirts | price |
| 100 feet | $50 |
| 200 feet | $100 |
| 300 feet | $150 |
| 400 feet | $200 |
Is the relationship between the length of the wire and the cost of the wire linear or non-linear? If it is linear, what is the slope in terms of dollars per foot?
1. Think of one example of a linear relationship and one example of a non-linear relationship. Remember - you want to consider two different variables, like "number of tacos" and "price". As we buy more tacos, there’s often a discount, making the price per taco cheaper and cheaper. This would be non-linear because it is not a constant rate of change for price.