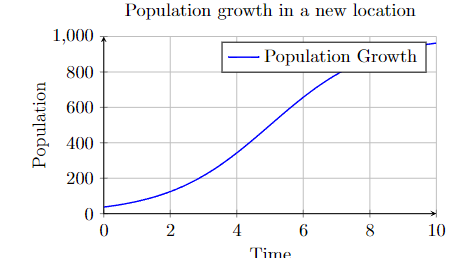
A typical example of a logistic relationship between two variables is population growth over time. As the variable time increases, a population grows quickly, but then the increase of the population slows down as the population reaches a carrying capacity.

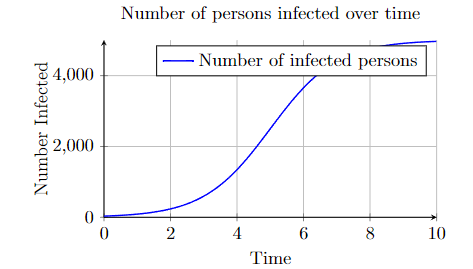
Another logistic relationship would be the number of persons infected with a disease in a population that does not yet have immunity. At first, the number of infected persons grows at a faster and faster rate until the disease starts encountering people who have gained immunity. The disease continues to infect new people, but at a slower and slower rate.

1.
A heating system has died in a home. The system was recently
repaired. The following data represents the temperature change per hour
in the home now that the furnace is running:
| hours since heat returns | temperature (F) |
| \(0\) | \(37^{\circ}\) F |
| \(1\) | \(40^{\circ}\) F |
| \(2\) | \(45^{\circ}\) F |
| \(3\) | \(55^{\circ}\) F |
| \(4\) | \(60^{\circ}\) F |
| \(5\) | \(63^{\circ}\) F |
Is the relationship between time and temperature approximately logistic for this home?
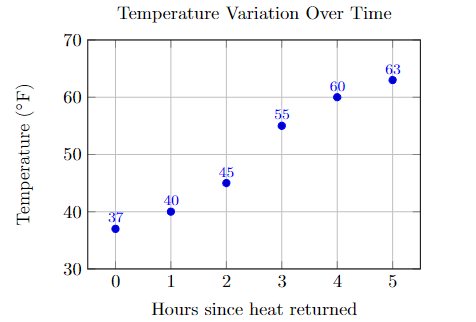
We have not learned the tools to algebraically determine if this is a logistic relationship, but we can make the determination visually. We should sketch out a scatter plot. To make a scatter plot, label the x-axis as the independent variable (time is always independent), and the y-axis as the other variable (temperature in our case).
Next, note the highest and lowest x-value. For our data set, x = 0 is the lowest and x = 5 is highest. We make 6 vertical lines on the x-axis.
Do the same for the y-axis. The lowest value is 37 and the highest value is 63. We can make however many horizontal lines we’d like. We can start at y = 30 and count by 10s, which would mean we can stop after 5 horizontal lines.
Place dots that correspond to the data points in the table. The scatter plot looks like this:

When determining whether a graph is logistic, there are a few things you should look for.
The graph should always be either increasing when reading from left-to-right, or always decreasing.
If the graph is always increasing, the function should be increasing slowly on the left side of the graph, then increase faster near the center, then increasing slower on the right side.
If the graph is always decreasing, the function should be decreasing slowly on the left side of the graph, decrease quickly near the center, then decreasing slower on the right side.
This graph appears to be logistic as the temperature climbs by 3 in the first hour, by 5 in the second hour, by 10 in the third hour, then slows its rate of increase and climbs by 5, then by 3. It starts (on the left) growing fast, then its rate of growth slows near the end (on the right).
2.
An account has money in it and is collecting interest. No
additional money is deposited into the account over time. The following
table represents the amount of money in the account over time. The
numbers have been rounded for graphing convenience.
| year | $ in account |
| \(2000\) | $10,000 |
| \(2002\) | $11,700 |
| \(2004\) | $13,700 |
| \(2006\) | $16,100 |
| \(2008\) | $18,800 |
| \(2010\) | $22,100 |
| \(2012\) | $25,900 |
| \(2014\) | $30,300 |
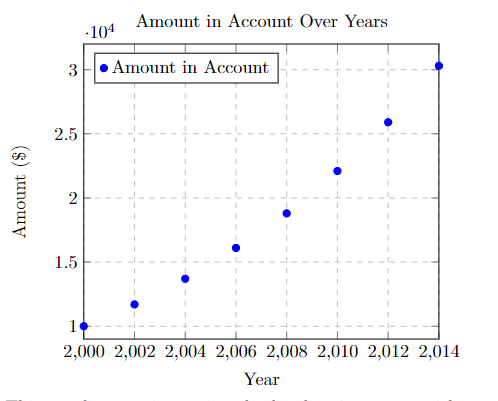
Is this an approximately logistic relationship? To make a decision, we can make a scatter plot.

This graph starts increasing slowly, then increases quicker near the center. Those two facts indicate that it might be logistic. However, a logistic function slows down as we move to the right on the x-axis. Maybe with more data we would see a scatter plot eventually slow down its rate of increase, but this graph only continues to increase quicker and quicker. This is not logistic. This appears to be exponential.
1. A business owner wants to know how many employees to have on hand at certain times of their restaurant. They record the following data set:
| international time | number of customers |
| \(10\) | $10 |
| \(11\) | $40 |
| \(12\) | $60 |
| \(13\) | $40 |
| \(14\) | $10 |
| \(15\) | $40 |
| \(16\) | $60 |
| \(17\) | $40 |
Is the relationship between the time of day and the number of customers approximately logistic?
2. A web developer creates niche websites. They record data on traffic for their site so that they can predict how many users to expect on their servers.
| days since site launch | number of users |
| \(10\) | $10,000 |
| \(20\) | $12,000 |
| \(30\) | $20,000 |
| \(40\) | $30,000 |
| \(50\) | $38,000 |
| \(60\) | $40,000 |
Is the relationship between "days since site launch" and "number of users" approximately logistic?
1. How would you describe a logistic relationship to someone who has not heard of one before?
2. How does a logistic relationship compare to other variable relationships that you know?